
TensorFlow 101C. Image Texture
This Note is for image texture explanation:
- Reference
https://courses.cs.washington.edu/courses/cse576/book/ch7.pdf (computer vision)
- Why Texture
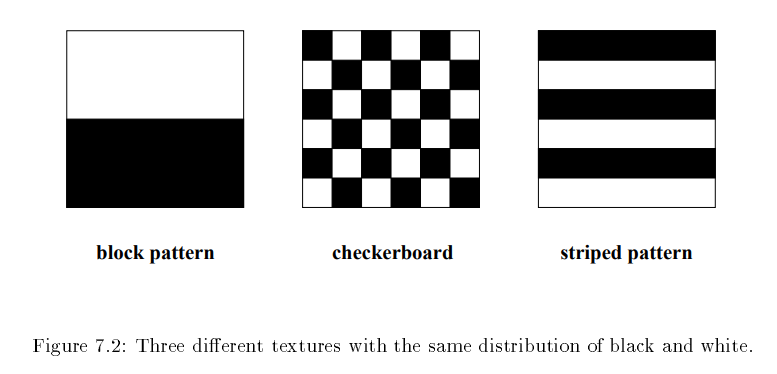
Texture gives us information about the spatial arrangement of the colors or intensities in an image. Why?
The answer is the histogram can’t fully represent/classify images. All images below are half white and half black. However, the images are different.
- How to recognize texture
- Structural approach: Texture is a set of primitive texels in some regular or repeated relationship.
- Statistical approach: Texture is a quantitative measure of the arrangement of intensities in a region.
- Statistical method
- Co-occurrence Matrices and Feature
- Basic concept
- Explanation in data:
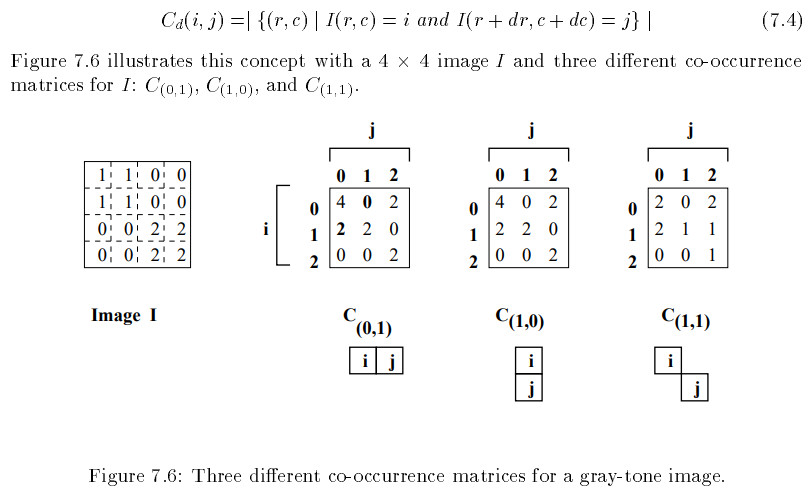
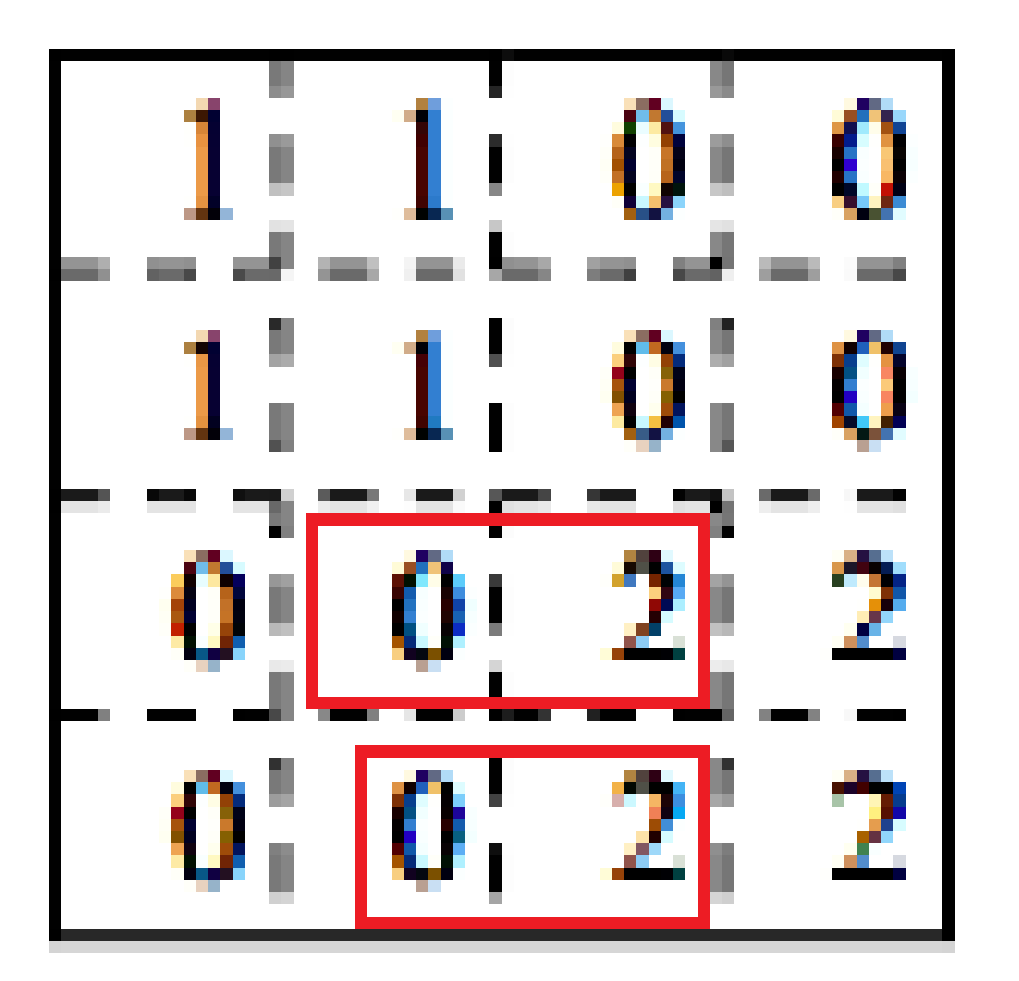
In the matrix of C(0,1), the first row is 4, 0, 2. (Which measure the occurrence of the values of two adjacent cells in the same row)
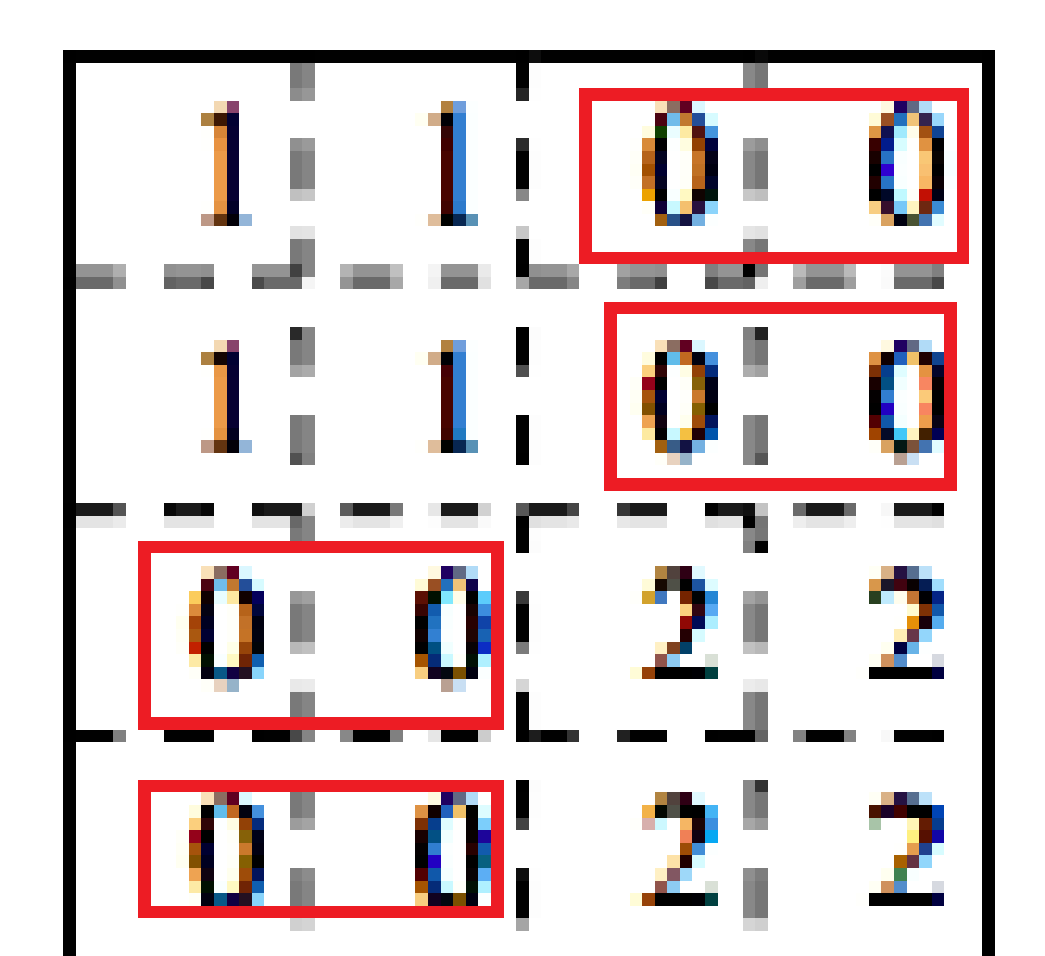
[0,0]=4 means: In the two adjacent cells (in the same row) of Image I, the # of of occurrence of (the left cell =0 and the right cell=0) is 4, as shown the red rectangles in image below.
[0,1]=0 means: in the two adjacent cells (in the same row) of Image I, the # of of occurrence of (the left cell =0 and the right cell=1) is 0.
[0,2]=2 means: in the two adjacent cells (in the same row) of Image I, the # of of occurrence of (the left cell =0 and the right cell=2) is 2.
- Probability of the occurrence:
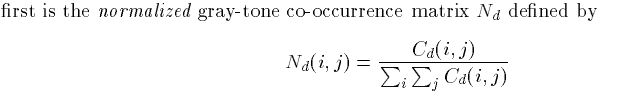
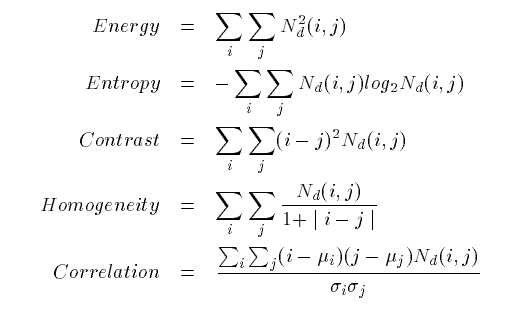
- Co-occurrence matrices capture properties of a texture, but they are not directly useful
For further analysis, such as comparing two textures. Instead, numeric features are computed from the co-occurrence matrix that can be used to represent the texture more compactly. The following are standard features derivable from a normalized co-occurrence matrix.
- Laws’ Texture Energy Measure
Another approach to generating texture features is to use local masks to detect various Types of texture. Laws developed a texture-energy approach that measures the amount of variation within a fixed-size window
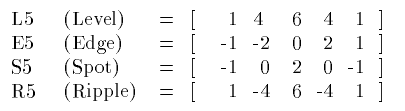
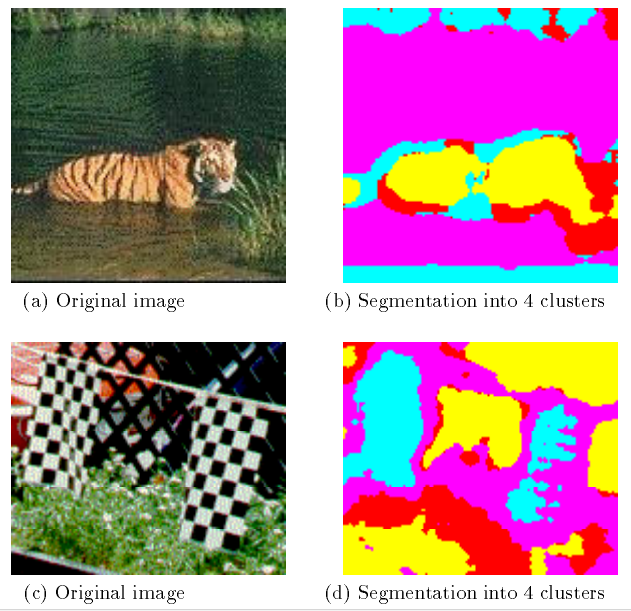
Figure 7.8 shows the segmentation of several images using
The Laws texture energy measures and a clustering algorithm to group pixels into regions
Related News
AUC (Area Under the Curve) – The Performance-Based Model Selector for Pega Binary Prediction Models
The metrics for binary models is AUC, F-score for categorical models and RMSE for continuousRead More
......Pega Certified Exam for Decisioning Consultant & Data Scientist (PCDC, PCDS)
Within two-month study (Oct and Nov, 2022), I passed the PCDC exam and the PCDSRead More
......